If there is a substantial expansion of the size of the federal Parliament, it will be a rare event. It has only happened twice before since federation, and hasn’t happened at all in my lifetime. About two thirds of Australian voters hadn’t cast their first vote before the last expansion in 1984.
At that year’s election, the House of Representatives was expanded from 125 to 148, adding 23 new electorates across the five mainland states. Almost every seat was redrawn, and the map looked quite different aftwards.
So with something so rare, how do we know how it would likely play out?
This is the first of two blog posts where I look at the electoral map of the early 1980s. For today’s post, I look just at how the map changed, before the 1984 election. I compare the results of the 1983 election to Malcolm Mackerras’ estimates of margins for the new electorates to identify how the distribution of marginal seats changed, and how the pendulum changed.
For the next blog post, I am going to look at how the new map affected the election – where MPs decided to run and which seats were left without a sitting MP, and how incumbency influenced swings against the Labor government.
I should clarify that in this blog post I will not be looking at all at the results of the 1984 election. Any comparison of 1983 and 1984 is simply comparing the different boundaries, both based on 1983 voting data. Everything in this blog post could have been known before election day in 1984.
First, what were the total number of seats per party? There were no non-classic seats back in 1983, so this is really just a story about the major parties.
window.addEventListener("message",function(a){if(void 0!==a.data["datawrapper-height"]){var e=document.querySelectorAll("iframe");for(var t in a.data["datawrapper-height"])for(var r,i=0;r=e[i];i++)if(r.contentWindow===a.source){var d=a.data["datawrapper-height"][t]+"px";r.style.height=d}}});
Labor’s share of seats was almost unchanged. If they held 88 notional seats, that would have been as close as possible to the 1983 result. They held just one more.
The Liberal Party hold a slightly higher number of seats relative to the National Party, but it is more difficult to judge which of the two parties would win seats where both had previously competed. In the end the Liberal Party lost two seats to the National Party and the National Party lost one to the Liberal Party, which closes half the gap between the 1983 result and 1984 boundaries.
But it’s not just about how many seats each party holds, but what margin they are held by. If one party can replace marginal seats with safer seats, that can change the landscape, particularly in the 1983 context when the Hawke government’s first victory was one of Labor’s biggest. Proportionally it was just a bit less than the Albanese government’s landslide victory in 2025.
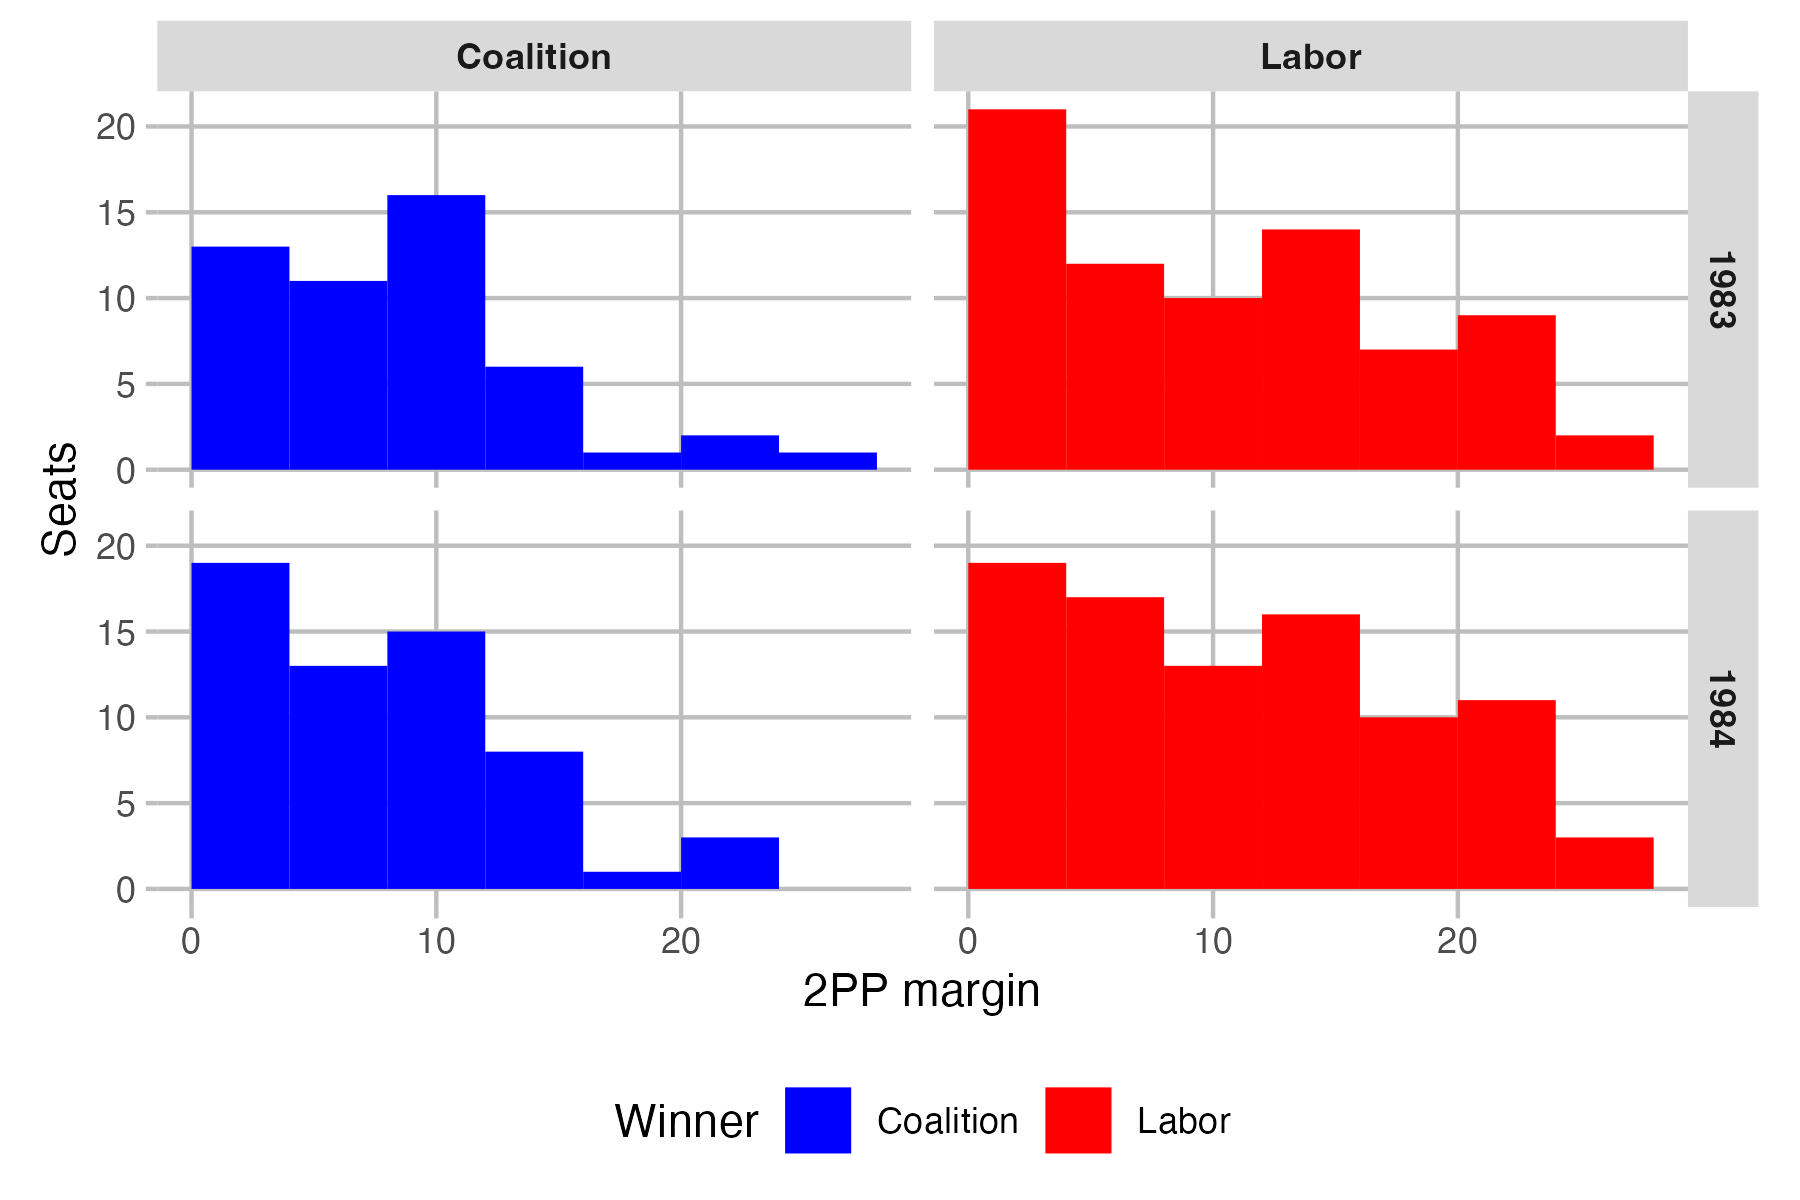
This chart shows the distribution of Coalition and Labor seats by margin. The shapes look fairly similar, although there are some notable differences amongst the most marginal seats.
Labor won a much higher proportion of the very marginal seats (under 4%) in 1983, but on the 1984 boundaries these seats were split roughly equally. This means other Labor seats must have become safer.
Taking the same data and presenting it in a different way, this graph shows two lines showing the cumulative number of seats with a given Coalition 2PP (or less).
window.addEventListener("message",function(a){if(void 0!==a.data["datawrapper-height"]){var e=document.querySelectorAll("iframe");for(var t in a.data["datawrapper-height"])for(var r,i=0;r=e[i];i++)if(r.contentWindow===a.source){var d=a.data["datawrapper-height"][t]+"px";r.style.height=d}}});
The two lines are almost identical. There are some small deviations amongst safe Labor seats, but the main point of interest is on a Labor 2PP of 52-54%. In general, these seats became better for Labor than they had been in 1983.
This is important because this is the range where Labor would lose its majority. Prior to the redistribution, a 2.15% uniform swing was needed for Labor to lose their majority. After the redistribution, this grew to a 3.1% uniform swing. This could have made a difference if the Coalition had done slightly better. Instead they had a swing of 1.5%.
So the redistribution mostly left the distribution of seats the same, but made Labor’s position a bit better in the case of a very close election. What about geographically? Did the location of marginal seats change?
window.addEventListener("message",function(a){if(void 0!==a.data["datawrapper-height"]){var e=document.querySelectorAll("iframe");for(var t in a.data["datawrapper-height"])for(var r,i=0;r=e[i];i++)if(r.contentWindow===a.source){var d=a.data["datawrapper-height"][t]+"px";r.style.height=d}}});
Not much changed on a state basis. Defining marginal seats as those with a margin under 6%, there wasn’t a lot of change. New South Wales was steady. Queensland had more marginals, as did Victoria and Western Australia, while South Australia had fewer marginals. Across the whole of Australia, the proportion of marginal seats increased slightly.
To get more specific about locations of marginal seats, I’ve produced a map. Seats that had a margin of under 6% (based on 1983 results) are marked in red, while all others are in white. You can toggle between 1983 and 1984 boundaries.
The marginals tend to be in similar areas, but not exclusively so. To take Sydney as an example, the seat of Dundas ceased to be marginal, but only just. Philip Ruddock’s margin grew from 2.7% to 6.9%. There was a band of marginal seats along the NSW coast and wrapping around Sydney, and this band is mostly intact.
Likewise looking at Melbourne, a lot of the marginals are in similar places, but there are differences. Burke becomes more marginal, and McEwen is a new marginal seat.
I was inspired to look into this topic because I often do analysis of marginal seats for clients and this raised the question – will the marginal seats be the same? The answer is, mostly, yes. But not entirely so. Areas that are particularly of interest in federal elections, like the northern suburbs of Sydney, or the eastern suburbs of Melbourne, will undoubtedly continue to be so, but the precise make-up of the seats and the relative marginality of seats within an area will surely change if the parliament is expanded.